TRACE
The TRACE tool helps us to understand complicated behavior over time for all kinds of systems through its domain-independent capabilities for visualizing and analyzing concurrent activities that are encoded in execution traces. TRACE supports claims on resources, events, dependencies, and continuous signals.
What TRACE offers
- Clear visualizations
Gantt charts with claims, events, dependencies, and signals for intuitive system dynamics. - Advanced analysis
Built-in methods for critical-path, latency, throughput, and resource usage analysis. - Compare & verify
Distance analysis for trace comparison and runtime verification using temporal logic. - Flexible & scalable
Works at all abstraction levels, across domains, and with traces from any source - logs, simulations, or real systems.
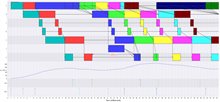
Figure 1
This figure shows a typical TRACE Gantt chart of an application that iteratively executes activities A-G. The claims model executions of these system activities and are shown as colored rectangles with a start and end time. Data flow between the activities is modeled by dependencies between claims, shown as arrows between the claims. Events, such as the start and end of an iteration of the application, are shown at the bottom as vertical arrows. The signal, above the events and below the claims, shows the throughput of the modeled system.
Why TRACE?
- Gain deep insight into system timing and resource interactions.
- Detect unforeseen behaviors and optimize performance.
- Support design-space exploration with Y-chart-based modeling.
TRACE is easy to learn, simple to apply, and proven to deliver valuable insights across industries.
Learn more about TRACE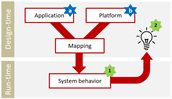
Figure 2
The Y-chart paradigm decomposes a system into an application, a platform, and the mapping between them, fostering reuse when one of these parts changes. Furthermore, it defines a feedback cycle to allow systematic design-space exploration (Figure 2). The Y-chart concepts of application, mapping and platform are realized in TRACE through the decomposition of an activity (e.g. an image-processing computation) into one or more claims on resources for a certain amount of time (e.g. two cores of the CPU and 20 MB of RAM for 50 ms). These are the main elements of the execution traces that capture system behavior (star-1 in Figure 2). To provide feedback on the system under analysis (star-2 in Figure 2), TRACE provides extensive visualization and analysis of execution traces.
Visualize and optimize system behavior with TRACE
TRACE delivers powerful insights into system dynamics by visualizing and analyzing execution traces. Its intuitive Gantt-style charts make complex behaviors easy to interpret, while advanced analysis methods—such as critical-path detection, runtime verification, and performance metrics—help identify bottlenecks and optimize system performance. TRACE is easy to learn, flexible to apply, and proven to accelerate design decisions for high-tech systems.
Get started with TRACE
Unlock powerful visualization and analysis for your system execution traces. The open-source version, TRACE4CPS, is available now - complete with installation instructions and release notes.
Download TRACE4CPS from Eclipse
Further information
Ready to unlock deep insights into system behaviour?
Discover how TRACE can help you visualize concurrent activities, analyze performance bottlenecks, and verify system properties with precision.
Contact us to explore how TRACE can transform your approach to system analysis.
Contact us
-

Jos Hegge
Functie:Program ManagerSpecialisatie niet bekend-
Telefoon:+31 88 866 54 20
-
E-mail:E-mail Jos
-
LinkedIn:Jos on LinkedIn
-
-

Jacques Verriet
Functie:Senior Research FellowSpecialisatie:System Performance-
Telefoon:+31 88 866 54 20
-
E-mail:E-mail Jacques
-
LinkedIn:Jacques on LinkedIn
-